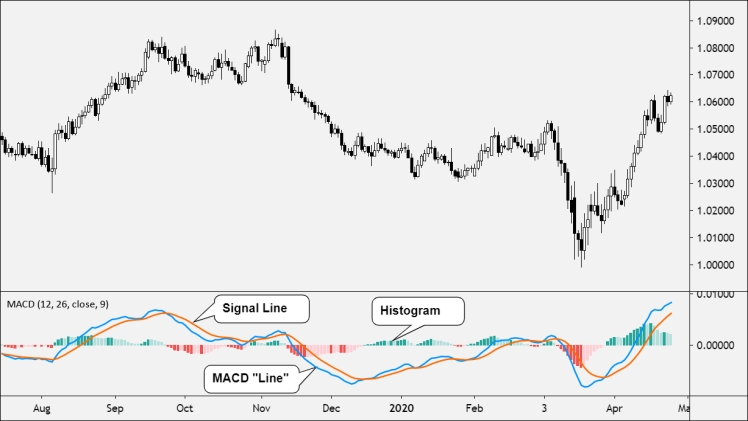
The Moving Average Convergence/Divergence indicator is a momentum oscillator that follows trends. Despite the fact that it is an oscillator, it is rarely employed to detect overbought or oversold positions. It shows as two oscillating lines with no limits on the chart. Trading signals are generated when the two lines cross, comparable to a two-moving-average technique.
macd (moving average convergence/divergence) is a technical analysis of stock prices indicator created by Gerald Appel in the late 1970s. Its goal is to highlight changes in the intensity, direction, velocity, and length of a stock’s price trend.
TRADING STRATEGY
Moving Averages Average Divergence Convergence Divergence Convergence Divergence Convergence As the name implies, MACD stands for Moving Average Convergence and Divergence.
To refresh your memory, convergence and divergence are the apparent differences between the price and the indicator, in this instance the indicator’s moving averages. Depending on the sort of divergence MACD is showing us, we might have a MACD bearish divergence or a MACD bullish divergence. As shown in the chart below, we can also have bearish convergence and bearish divergence.
What is the most effective method for creating a MACD divergence strategy? To do so, we need to understand how a MACD bearish or bullish divergence MACD is created. Consider the following scenario: The magnitude of price variations is depicted by the momentum indicator.
The term “price momentum” refers to a price that is rapidly moving in one direction. At some point, the momentum will move from bull to bear or bear to bull. The MACD indicator keeps track of these movements. Every positive or negative momentum peak becomes the indicator’s outer point. The tops and bottoms of the indicator are formed by bullish and bearish momentum peaks. These peaks and bottoms indicate how strong the motion is.
When a series of peaks form a downward trend, for example, the momentum is declining. When a series of bottoms establish an upward trend, momentum is building. What exactly is MACD trading at this point? It requires assessing the trend and its momentum before comparing it to price action to see if divergence or convergence has occurred. After that, the MACD divergence indicator is used to compare this momentum to the price movement.
HOW MACD CALCULATED
The MACD is calculated by subtracting the 26-period exponential moving average (EMA) from the 12-period EMA. The “signal line,” a MACD nine-day EMA, is then put on top of the MACD line, which may be used to generate buy and sell signals.
MACD CRYPTO SETTING
The macd indicator is based on 12- and 26-period moving averages, respectively. These settings are never changed, so it’s best to ignore them. It’s important to remember that indicators work best when the majority of people perceive the same signals. As a consequence, the bitcoin MACD crypto settings should be kept between 12 and 26 at all times.
This means that each MACD you see has the identical appearance. The Ethereum MACD is comparable to the Amazon stock MACD, whereas the Binance MACD is identical to the Kraken MACD.
HOW TO USE MACD
Buy or close a short position when the MACD crosses above the zero line; sell or close a long position when the MACD crosses below the zero line. Because of the strategy’s delayed nature, it should be used with caution in fast, volatile markets, where indications are occasionally supplied too late.
HOW TO READ MACD
When the MACD line crosses from below to above the signal line, the indicator is considered bullish. As the signal falls below the zero line, it grows stronger. When the MACD line crosses from above to below the signal line, the indicator is considered bearish. As the signal rises above the zero line, it grows stronger.


