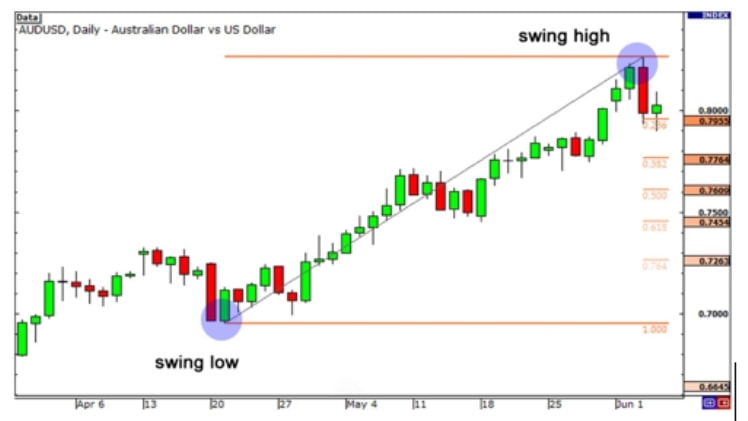
The Fibonacci retracement tool can help you identify support and resistance levels for trades. You can also use it as a confirmation indicator, which will let you know if the trend is changing. Typically, you’ll use the ratios of 23.6%, 50%, 61.8%, and 78.6%. This mathematical sequence was developed by Indian mathematicians centuries before Leonardo Fibonacci.
So how to use fibonacci retracement? Fibonacci retracement levels can be helpful as support and resistance levels, but it should be used in conjunction with other technical analysis tools. By using a combination of retracement levels, you will have a complete picture of the current situation in the market. This method can also be used as a trading decision-making tool. For example, you can use it to identify pivot points and areas where the price is likely to move. It is more useful in trending markets, and you don’t need to know the Fibonacci sequence to use the tool.
The Fibonacci retracement tool can be applied to an uptrend to find buying opportunities. A bullish candlestick pattern formed at the 23.6 fib level and then stretched back to the 38.2 fib level. A bullish candlestick pattern was created at the 61.8 level. It closed above the 50.0 fib level, confirming a buy entry. You should set your stop loss to slightly under the low and exit when the trend has completed.
Using the Fibonacci retracement tool can be useful for small moves, and you can also use it as a confirmation to trade signals. The Fibonacci levels are close together, so you won’t have to spend a long time analyzing your charts. A chart with Fibonacci retracements will give you a directional direction, and the Fibonacci retracement can act as a guide for your trades.
When using the Fibonacci retracement tool, you need to determine the best time to enter a position. A trending security will often retrace to a Fibonacci retracement level that provides a signal to enter a new position. A downtrend may be a sign to sell, and an uptrend might indicate a long-term trend.
To use the Fibonacci retracement tool, you must first select a trough and a peak. You must select the trough first and drag the line until it reaches the peak. The Fibonacci retracement tool is a useful tool for analyzing a price trend. The retracement can also be used to spot profitable entry and exit zones.
It is also important to note that the Fibonacci retracement levels do not always correspond to exact reversal points. In fact, they are often a bit off and will not make you profit if you ride the trend. It is best to use the Fibonacci retracement with other indicators to help you analyze the trends in the market. The key is to be patient.


